

The Iowa Caucuses: Confronting Our Innumeracy (#2)
Feb 5, 2016
This second post in a short series on TV news innumeracy looks at an even more ludicrous example – the notion of “bellwether” counties. The pundits seem to have an obsession with counties – or towns, or even precincts – that have voted for the winning side in several consecutive elections, as if that information actually meant anything. Well, it doesn’t, and the reason it doesn’t has implications for financial analysis.
It doesn’t for two reasons: (1) It’s all random! Put another way, if you collect enough data – so simple in this age of Big Data – you will find some amazing relationships even if there is no underlying causality. In the U.S., there are 3,144 counties. If how each county voted in U.S. presidential elections were completely random, but in any election 55% of the counties voted for the ultimate winner (that probability may be a little low, but let’s go with it), this table shows the number of counties that would be expected to vote for the winner in five or more consecutive elections (or in all but one election in the sequence):
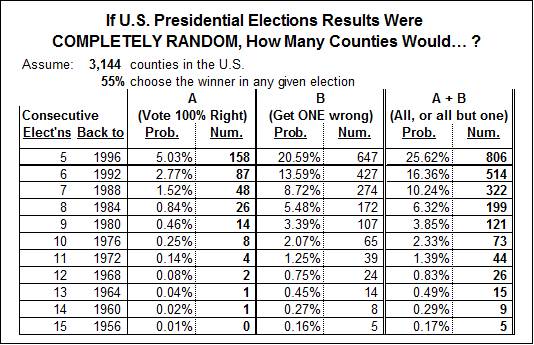
For example, the probability a county would vote for the ultimate winner in seven consecutive elections is 1.52%, totaling 48 of the 3,144 counties. And the probability that a county would choose the winner in either all or all but one of ten consecutive elections is 2.33%, or 73 counties. So when the pundits tell you they’ve found the perfect “bellwether” county, don’t be impressed – they’ve got more than 3,000 to choose from. (There’s even a Wikipedia entry for “Bellwether”, which not only lists some of these counties, but teaches us that the origin of the word has to do with castrated rams.)
And… (2) The information is of no use! Even if there actually were such a thing as a “bellwether” county – see discussion above – what would you do with that information? Since everyone votes at the same time, we don’t learn how the “bellwether” counties vote until the voting is over. So you can’t even use the information to place a bet.
I admit I’m a politics junkie. When elections returns are on TV, I’m glued to my chair. I can’t get enough of Joe Trippi and Karl Rove pontificating contrapuntally on the meaning of the Iowa primary results, sliced and diced into tiny, meaningless slivers, or John King waving his hands over an animated precinct map color-coded for fundamentalists vs. atheists. But sometimes it’s best just to pretend you’re watching a sports event.
What does this have to do with financial analysis? Well, the same logical flaw is possible every time you analyze a lot of data – click here and here for my posts about a particularly stupid way to predict the S&P 500. And all of this is made ever more possible by Big Data. So, hey, BE CAREFUL OUT THERE!
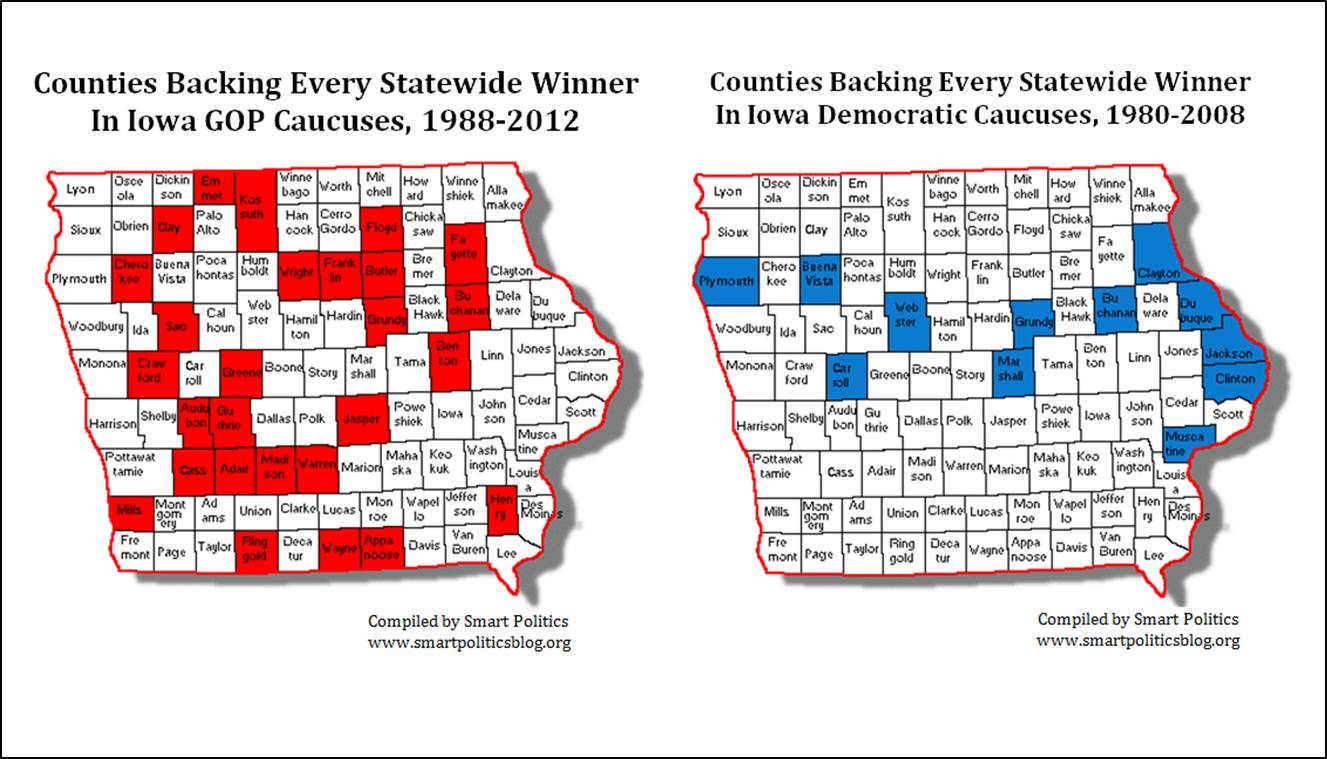
Oh, and lest you think this obsession is just for the general election, take a look at this, from Smart Politics:
“Painting with Numbers” is my effort to get people to focus on making numbers understandable. I welcome your feedback and your favorite examples. Follow me on twitter at @RandallBolten.
Other Topics