

The Presidency, The House, Political Parties -- Recasting the Data (#6)
Dec 30, 2014
We leave 2014 with one more look at using quantation to understand the ebb and flow of political parties in the U.S., and especially whether graphs or well-designed tables make points best. This time, let’s try an unusual, but sometimes effective technique: recasting the data. Rather than looking at individual presidents and individual elections, let’s look at – for want of a better term – “dynasties,” that is, continuous periods where a single party controlled the presidency, and see how that party fared in the U.S. House during that dynasty:
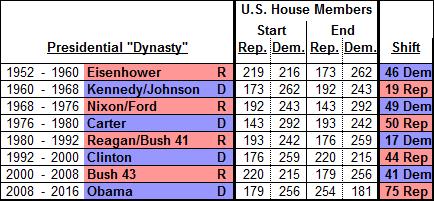
As before, we use color coding to identify the dynasty’s party and the party that gained seats in the House during that dynasty. Each of the eight dynasties since 1952 has lasted two terms, except for Carter (one term) and Reagan/Bush (three terms), and the results are amazingly consistent: every dynasty’s party lost House seats during the dynasty, ranging from 17 seats (Republicans under Reagan/Bush) to 75 seats (Democrats under Obama, through 2016).
This is the clearest exposition yet of U.S. political party dynamics, and much easier to see in a table than a graph. We are certainly a fickle electorate. When the presidency changes hands from one party to another, it’s typically a relatively high-water mark for that party’s representation in Congress. Then, we voters chip away at the president’s party’s congressional delegation, until we finally throw the bums out. Pundits often talk of the dynamics of mid-term elections, but there’s really something more powerful going on here.
(FYI, the last time the U.S. elected three consecutive presidents from the same party – not counting presidents who succeeded a president who died in office and then got elected in their own right – was the Republicans of 1860-1884. And the only one before that was the Democratic Republican dynasty of Jefferson/Madison/Monroe/Adams of 1800-1828.)
But we’re not that fickle. Only three times in our history have we had dynasties lasting just a single four-year term. The first two were three-term musical chairs games – Whig/Democrat/Whig in 1840-52 and Democrat/Republican/Democrat in 1884-96 (Grover Cleveland bookending Benjamin Harrison). Since then, the only one-term dynasty was the Democrat administration of Jimmy Carter in 1976-80. So I suppose we’re fickle but tolerant.
This has been an enjoyable exercise in various quantation techniques (click here to see posts #1, #2, #3, #4, and #5 in this series). I hope this shows that there are plenty of approaches available to present information clearly and effectively. Have a Happy New Year!
“Painting with Numbers” is my effort to get people to focus on making numbers understandable. I welcome your feedback and your favorite examples. Follow me on twitter at @RandallBolten.Other Topics