Boneheaded Comp Ideas – Excessive Binary-ness
Feb 3, 2015
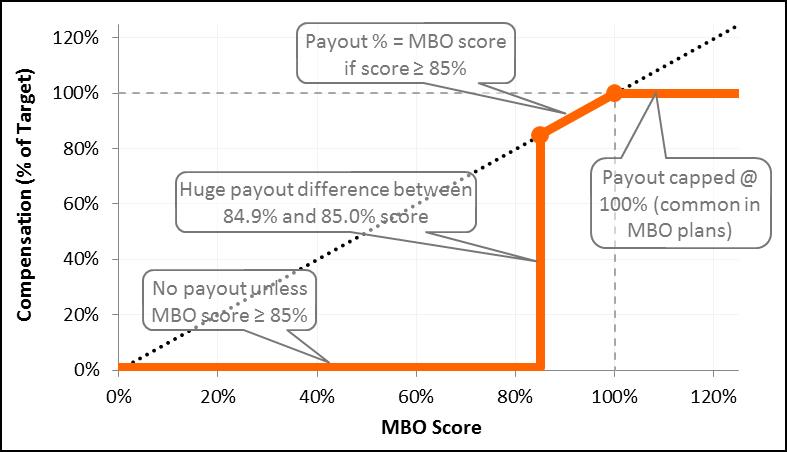
In my last post, we looked at a fundamental flaw in the Affordable Care Act: excessively binary incentives. This problem shows up, in spades, when designing incentive compensation plans. An experience at one of the companies where I worked provides a great example. Under the MBO bonus plan in place when I joined as CFO, employee performance against objectives was scored each year on a 0%-100% scale. The bonus payout was that percentage of their target bonus, with one critical wrinkle: the board of directors decreed that no one scoring below 85% on his/her MBOs would receive any bonus at all. This graph shows resulting compensation as a function of MBO performance (broken lines included for scale and reference):

Now, can you guess what happened? Here were some of the consequences of this approach:
- Given the dire consequence of falling short of 85% performance, employees were reluctant to agree to written objectives that were overly challenging or risky to achieve.
- Only the most flagrantly incompetent employees were ever scored below 85%. Most managers, after all, are human beings, and were reluctant to score employees below 85%, given the huge financial difference between an MBO score of 84% and one of 85%.
- As a result, everyone got pretty much the same bonus (as a percentage of their target amount).
- Because so many scores fell into a narrow band (85%-100%), MBO scores played no meaningful role in evaluating or ranking employee performance.
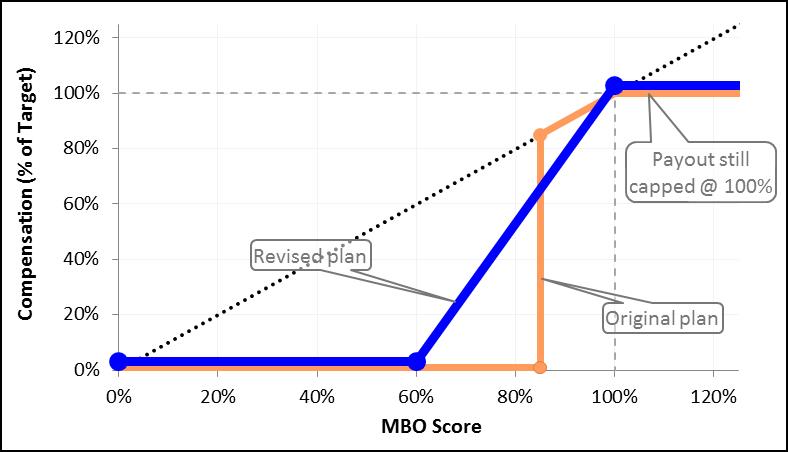
Now, it does make sense that employees whose principal compensation is salary should meet minimum performance standards in order to earn an additional bonus. So we revised the plan to have 60% as a “passing grade” (just like in school!). But we also instituted a straight linear progression in bonus payout for scores between 60% and 100%. The graphical mapping of MBO scores onto compensation is shown below (with the original plan graph as well, for comparison):

This plan is no longer “binary” – nowhere can a tiny change in scoring have an excessive marginal impact on compensation. The results were:
- Employees willing to agree to more challenging objectives,
- MBO scoring less heavily biased by payout considerations, and
- Large enough spread in MBO scores that the scores could contribute meaningfully to performance assessment.
The old plan was constructed by well-meaning directors and officers, but the “boneheaded” part was a failure to think through the behavioral consequences of the comp plan’s terms. This is an example where the math actually matters. Boneheaded compensation ideas crop up all the time. If you have your own “favorites,” please let me know of them and we’ll discuss.
I’ll add that the simple graphs shown above are a great example of the effective use of data visualization. When it comes to that technique, the simpler the better.
“Painting with Numbers” is my effort to get people to focus on making numbers understandable. I welcome your feedback and your favorite examples. Follow me on twitter at @RandallBolten.Other Topics


