

Data Visualization and the U.S. House - A New Approach (#4)
Dec 3, 2014
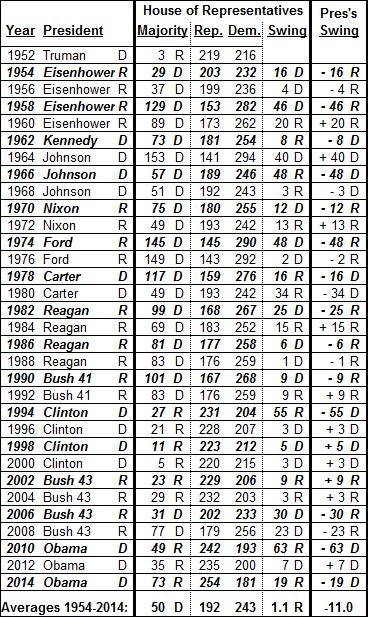
We’re back, and I’m hoping you all enjoyed the holiday. As I suggested in the last post, let’s try using a table instead of a graph to see how House of Representatives election results correlate with the incumbent president’s party:

As with the first graph we originally used, all the data are present: the identity of the president and his party, the House’s political party composition and its changes, and how the president’s party fared in each election (the second graph, introduced last week). Compared to a graph, here are some of the advantages of using a table:
- You see all the data, and with the precision of printed numbers rather than having to estimate them from reading a graph.
- The space taken up is about the same as each of the two graphs we’ve seen.
- Because all the data are present, the reader can examine and analyze the data from different perspectives, which isn’t always easy with a single-purpose graph.
- Data visualization is alive and well.It’s not just for graphs. See that:
- Cell shading color continues to identify the political party. (I’ve also used the “D” and “R” designations to further help the reader.) This way, even in a table, it’s easier to see how control of the presidency and the House has oscillated over the years.
- Bold italics distinguish mid-term election years from presidential election years.
- In the “Majority” and “Swing” columns, I’ve used a form of “heat map,” where the darkness of the cell shading is tied to the magnitudes of the majority and the change in party composition.
FYI, I generated the shading, as well as the bold italics for the mid-term election year rows, by using Excel’s Conditional Formatting feature.
- Creating this table was much less time-consuming. My total layout and formatting time was only about 30 minutes (not counting the conditional formatting, which added another hour or so).
- Perhaps most important, ratios and other key indicators add meaning and context to the raw numbers. The “Averages” at the bottom of the table show, for example, an average gain for the Republicans of 1.1 seats over the 31 election cycles (from 219 seats in 1952 to 254 seats in 2014). But there are a lot of ups and downs in there: the president’s party averaged a loss of 11 seats over that time. My, but we are a fickle electorate!
This last point, about ratios and key indicators, is a critical element of quantation, and deserves more discussion and examples. Stay with me – in the next post we’ll talk about that, and how we can make our points more simply, clearly, and precisely.
(NOTE: To see an uncolored version of the above table, click here!)
“Painting with Numbers” is my effort to get people to focus on making numbers understandable. I welcome your feedback and your favorite examples. Follow me on twitter at @RandallBolten.
Other Topics