What Makes Models Work? (#1)
Sep 9, 2015
We’ve been looking at a spreadsheet for evaluating alternatives for management reporting. It’s an approach that’s simple and straightforward, but even so it works beautifully. In fact, it can be an effective way to make any decision involving complex systems or processes. But what makes it so effective?
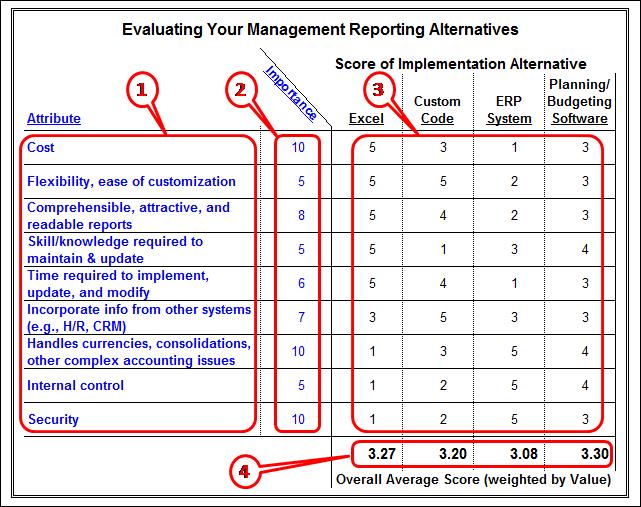
To refresh your memory, here’s the spreadsheet/model we were discussing (with red artwork corresponding to the numbered bullets below):

Remember to follow these instructions when using the model:
- List the Attributes important to your enterprise, such as cost, flexibility, and security.
- Assign an Importance value to each attribute.
- Assign a Score for each attribute, for each alternative you’re considering implementing.
- The resulting Overall Average Score for each implementation alternative is the average score for that alternative, weighted by the Importance of each Attribute.
The key here is: DON’T CHEAT! Finish Step 1 before going to Step 2, and Step 2 before going to Step 3. That’s critical because one of your biggest enemies when using models to make a decision is undetected bias – the harder it is for model users to directly associate their inputs with what the final scores turn out to be, the more robust the decision-making process is. In fact, some model builders will opt to put the final result (i.e., the “Overall Average Score” numbers shown above) in a completely separate worksheet, so users can’t tell how their inputs affect the final result, at least not instantly.
As with many other instances of quantation, good design isn’t only about the underlying mathematics and logic – it depends heavily on organizing your information to ensure that users and audiences are able to think clearly and honestly about it.
“Painting with Numbers” is my effort to get people to focus on making numbers understandable. I welcome your feedback and your favorite examples. Follow me on twitter at @RandallBolten.
Other Topics


